
Do you really know what is “hydrography”?
I would try to explain that showing you as well what Hydrographers are doing. This would be very short – but in the bottom you should find links to some places where you can find more about hydrography. If you are interested – just go there.
Hydrography
Hydrography is the science that measures and describes the physical features of bodies of water and the land areas adjacent to those bodies of water (from NOAA).
Generally hydrographers are doing surveys. And surveyor is not always hydrographer. But hydrographer is always surveyor.
The most important information which hydrographers are collecting is depth. During survey using different methods they are collecting depth values – so information about morphology of the bottom – about the shape and object which are on the bottom. To do that they are using different methods – starting from:
- manual lead line measurements – very historic… and slow with small density
- single beam echosounders – slow, low density but popular and accurate in the place of the measurements
- sweep systems – just a set of single beam sonars mounted on sides – so you have more data in one ping – popular on rivers – like Kongsberg EA system
- multibeam systems – high density and frequency – that is most popular now – as data are very dense we can use statistical calculations to “guess” where is the bottom.
- interferometric systems – those are maybe not so accurate like multibeam systems – but are better and better – giving you very high density data plus image – radio image of the bottom – side-scan image.
- LIDAR data – so laser data – mostly collected from planes. In general the density of the data depends from methodology used and from equipment – practical depth is up to 20-30m. This is used mostly close to coast on areas which are not so important for navigation.
- Side-scan systems – those systems are creating like a photo image of the bottom – based on the radio signal which is reflected from the bottom. Side-scan fish is normally towed very close to the bottom emitting radio signal on both sides and waiting for answer. This is creating shadows. So you can detect all the objects which are over the bottom. And you can as well recognise bottom types – as every type of the bottom is reflecting radio waves in different way with different amplitude.
- Cameras – just to identify objects and bottom types.
- Water Column data – not new technology – mostly used in fishing industry to find fish in the water… In the same way we can find objects and identify those. And we can add those to the bathymetry.
- ….
This is only a small part of techniques which are in use. There is much more for example to detect bottom type (Geocoder, Vibrocoller – to get profiles of the bottom sediments etc.)…. That you can find on pages which I have linked.
When you have the data collected – you need to process those. Normally data are very noisy – water is not always very clear for radio waves. First – sound velocity is changing all the time, second – you have objects in water, next – your bottom normally is not very solid – and can change in any moment. That is causing issues with the response level of the radio signal.
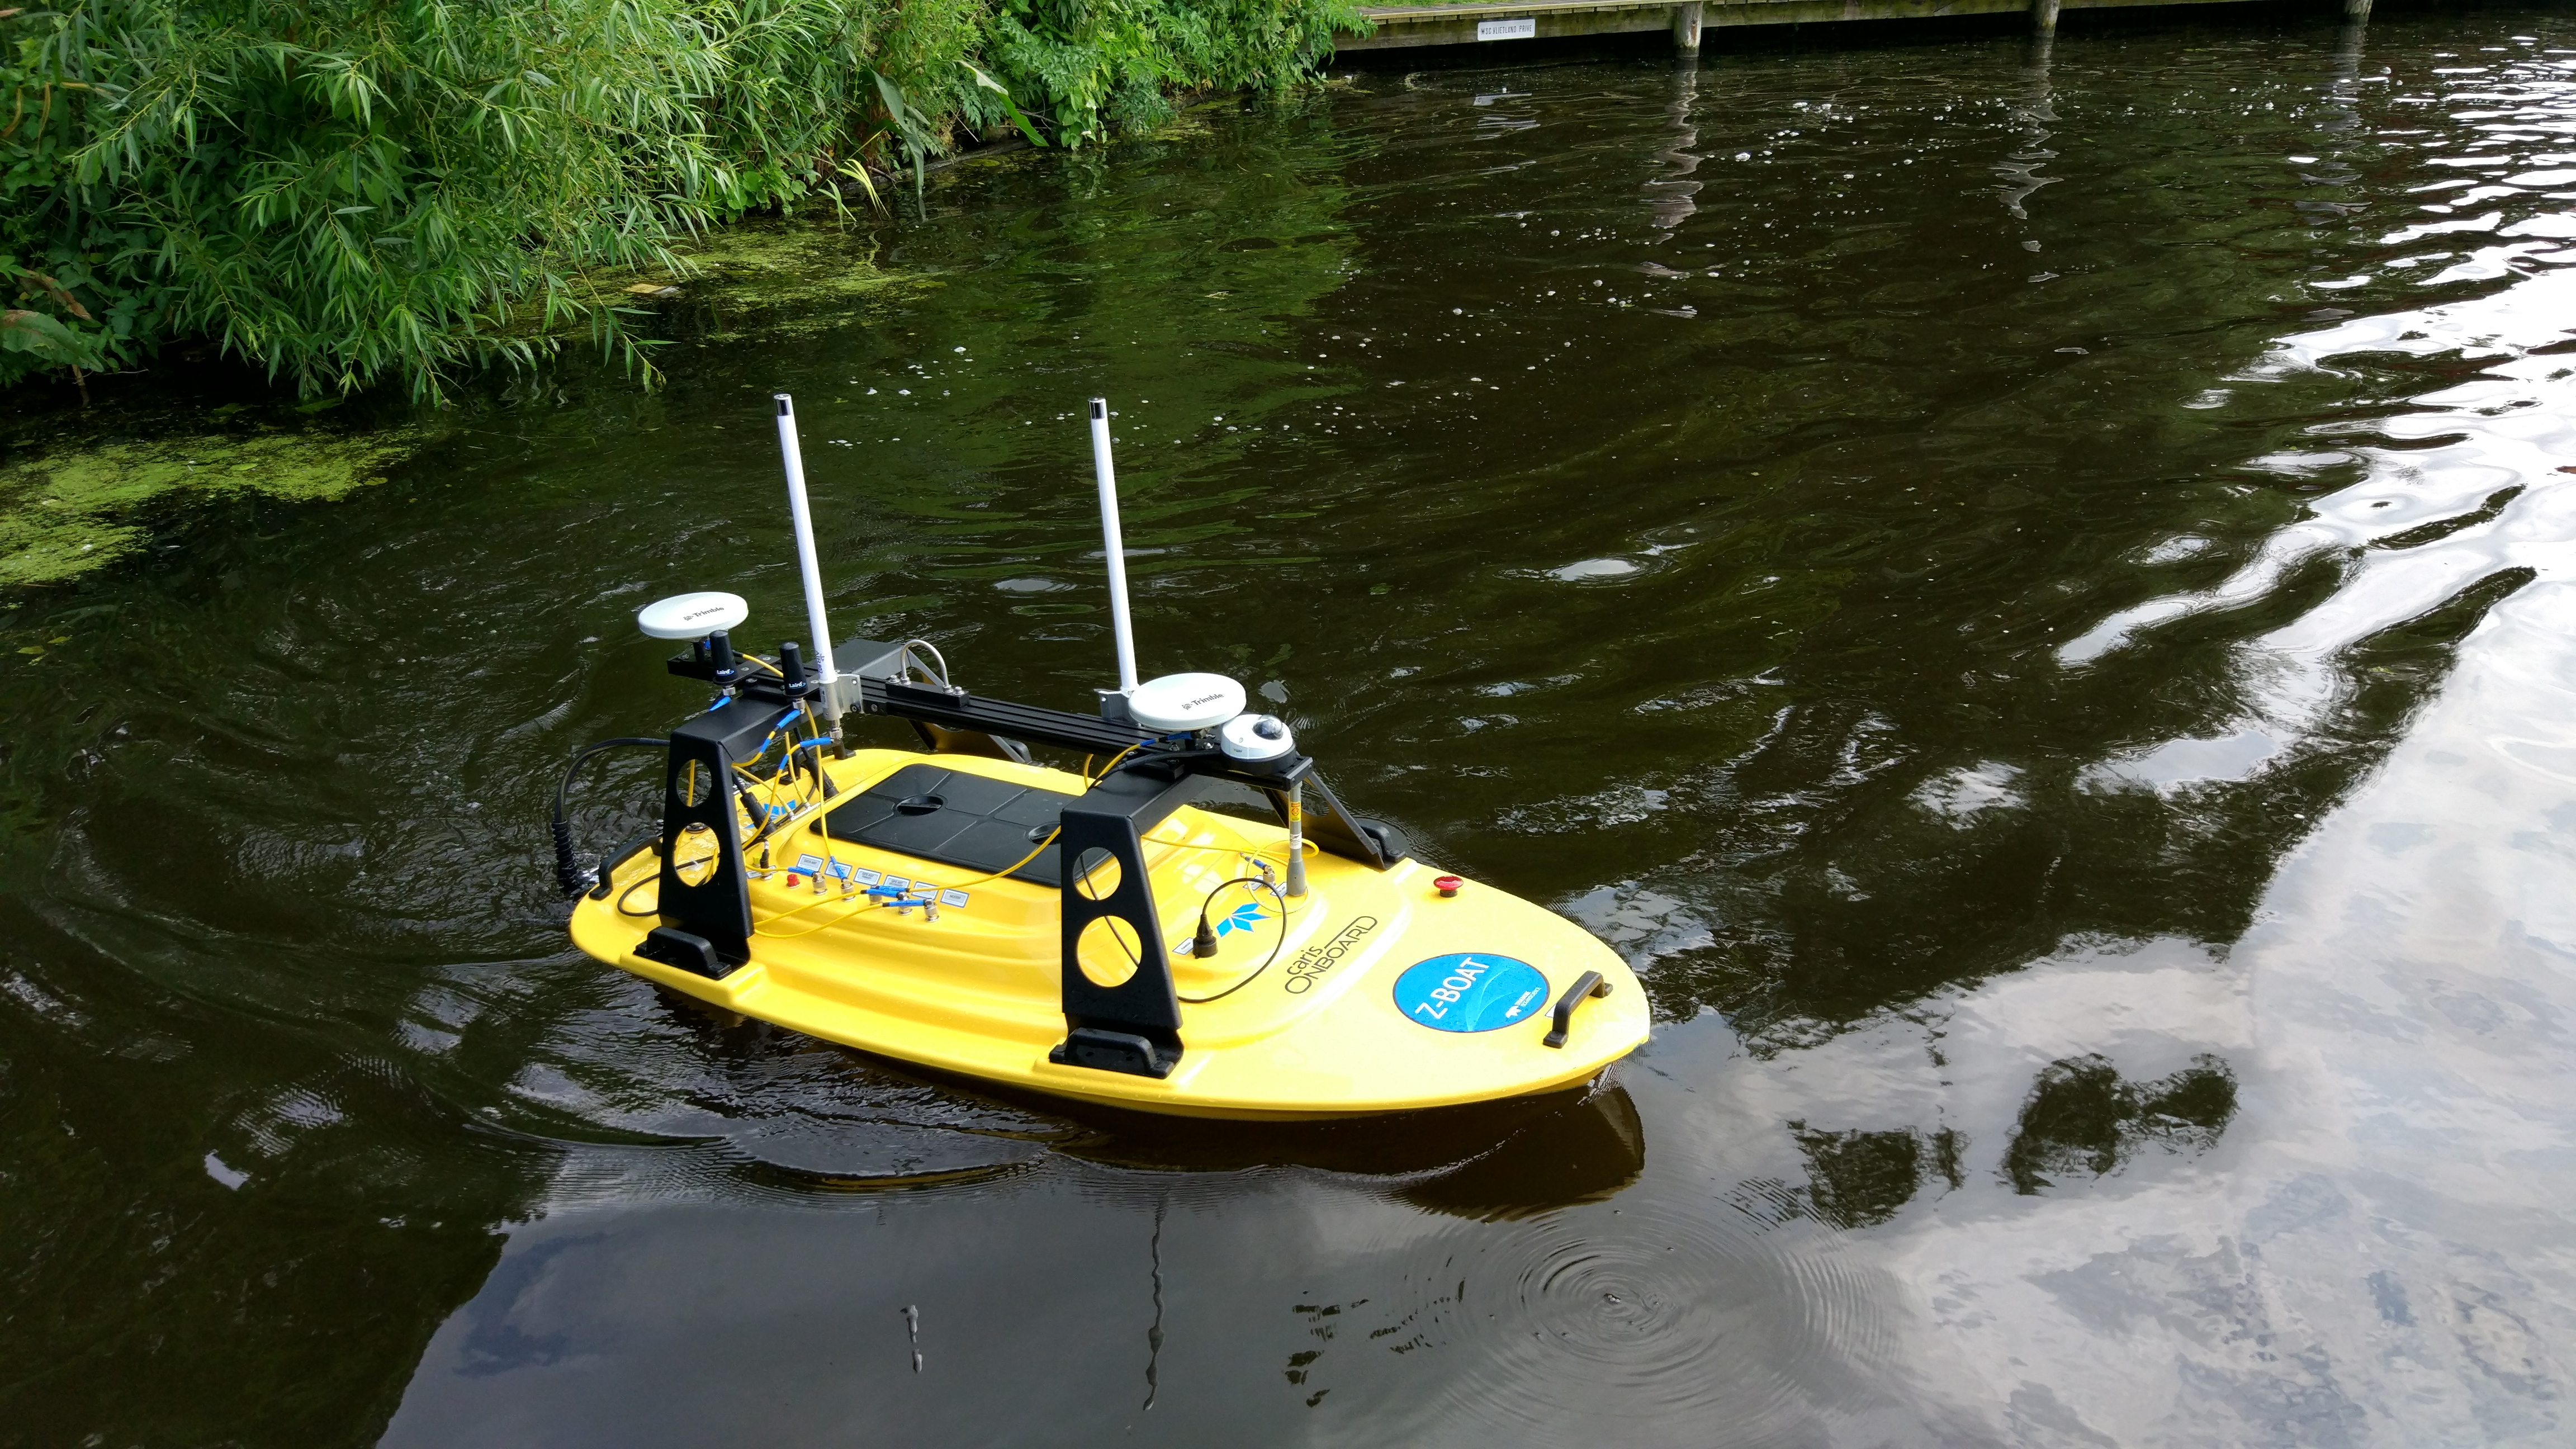
Cleaning of the data can be used in a few ways – semi-automatic cleaning – for example using CARIS Onboard with CUBE theory – application which is processing the data automatically just after you collect. In that case after cleaning you need to check the data – you have to check quality of the data and eventually fix results.
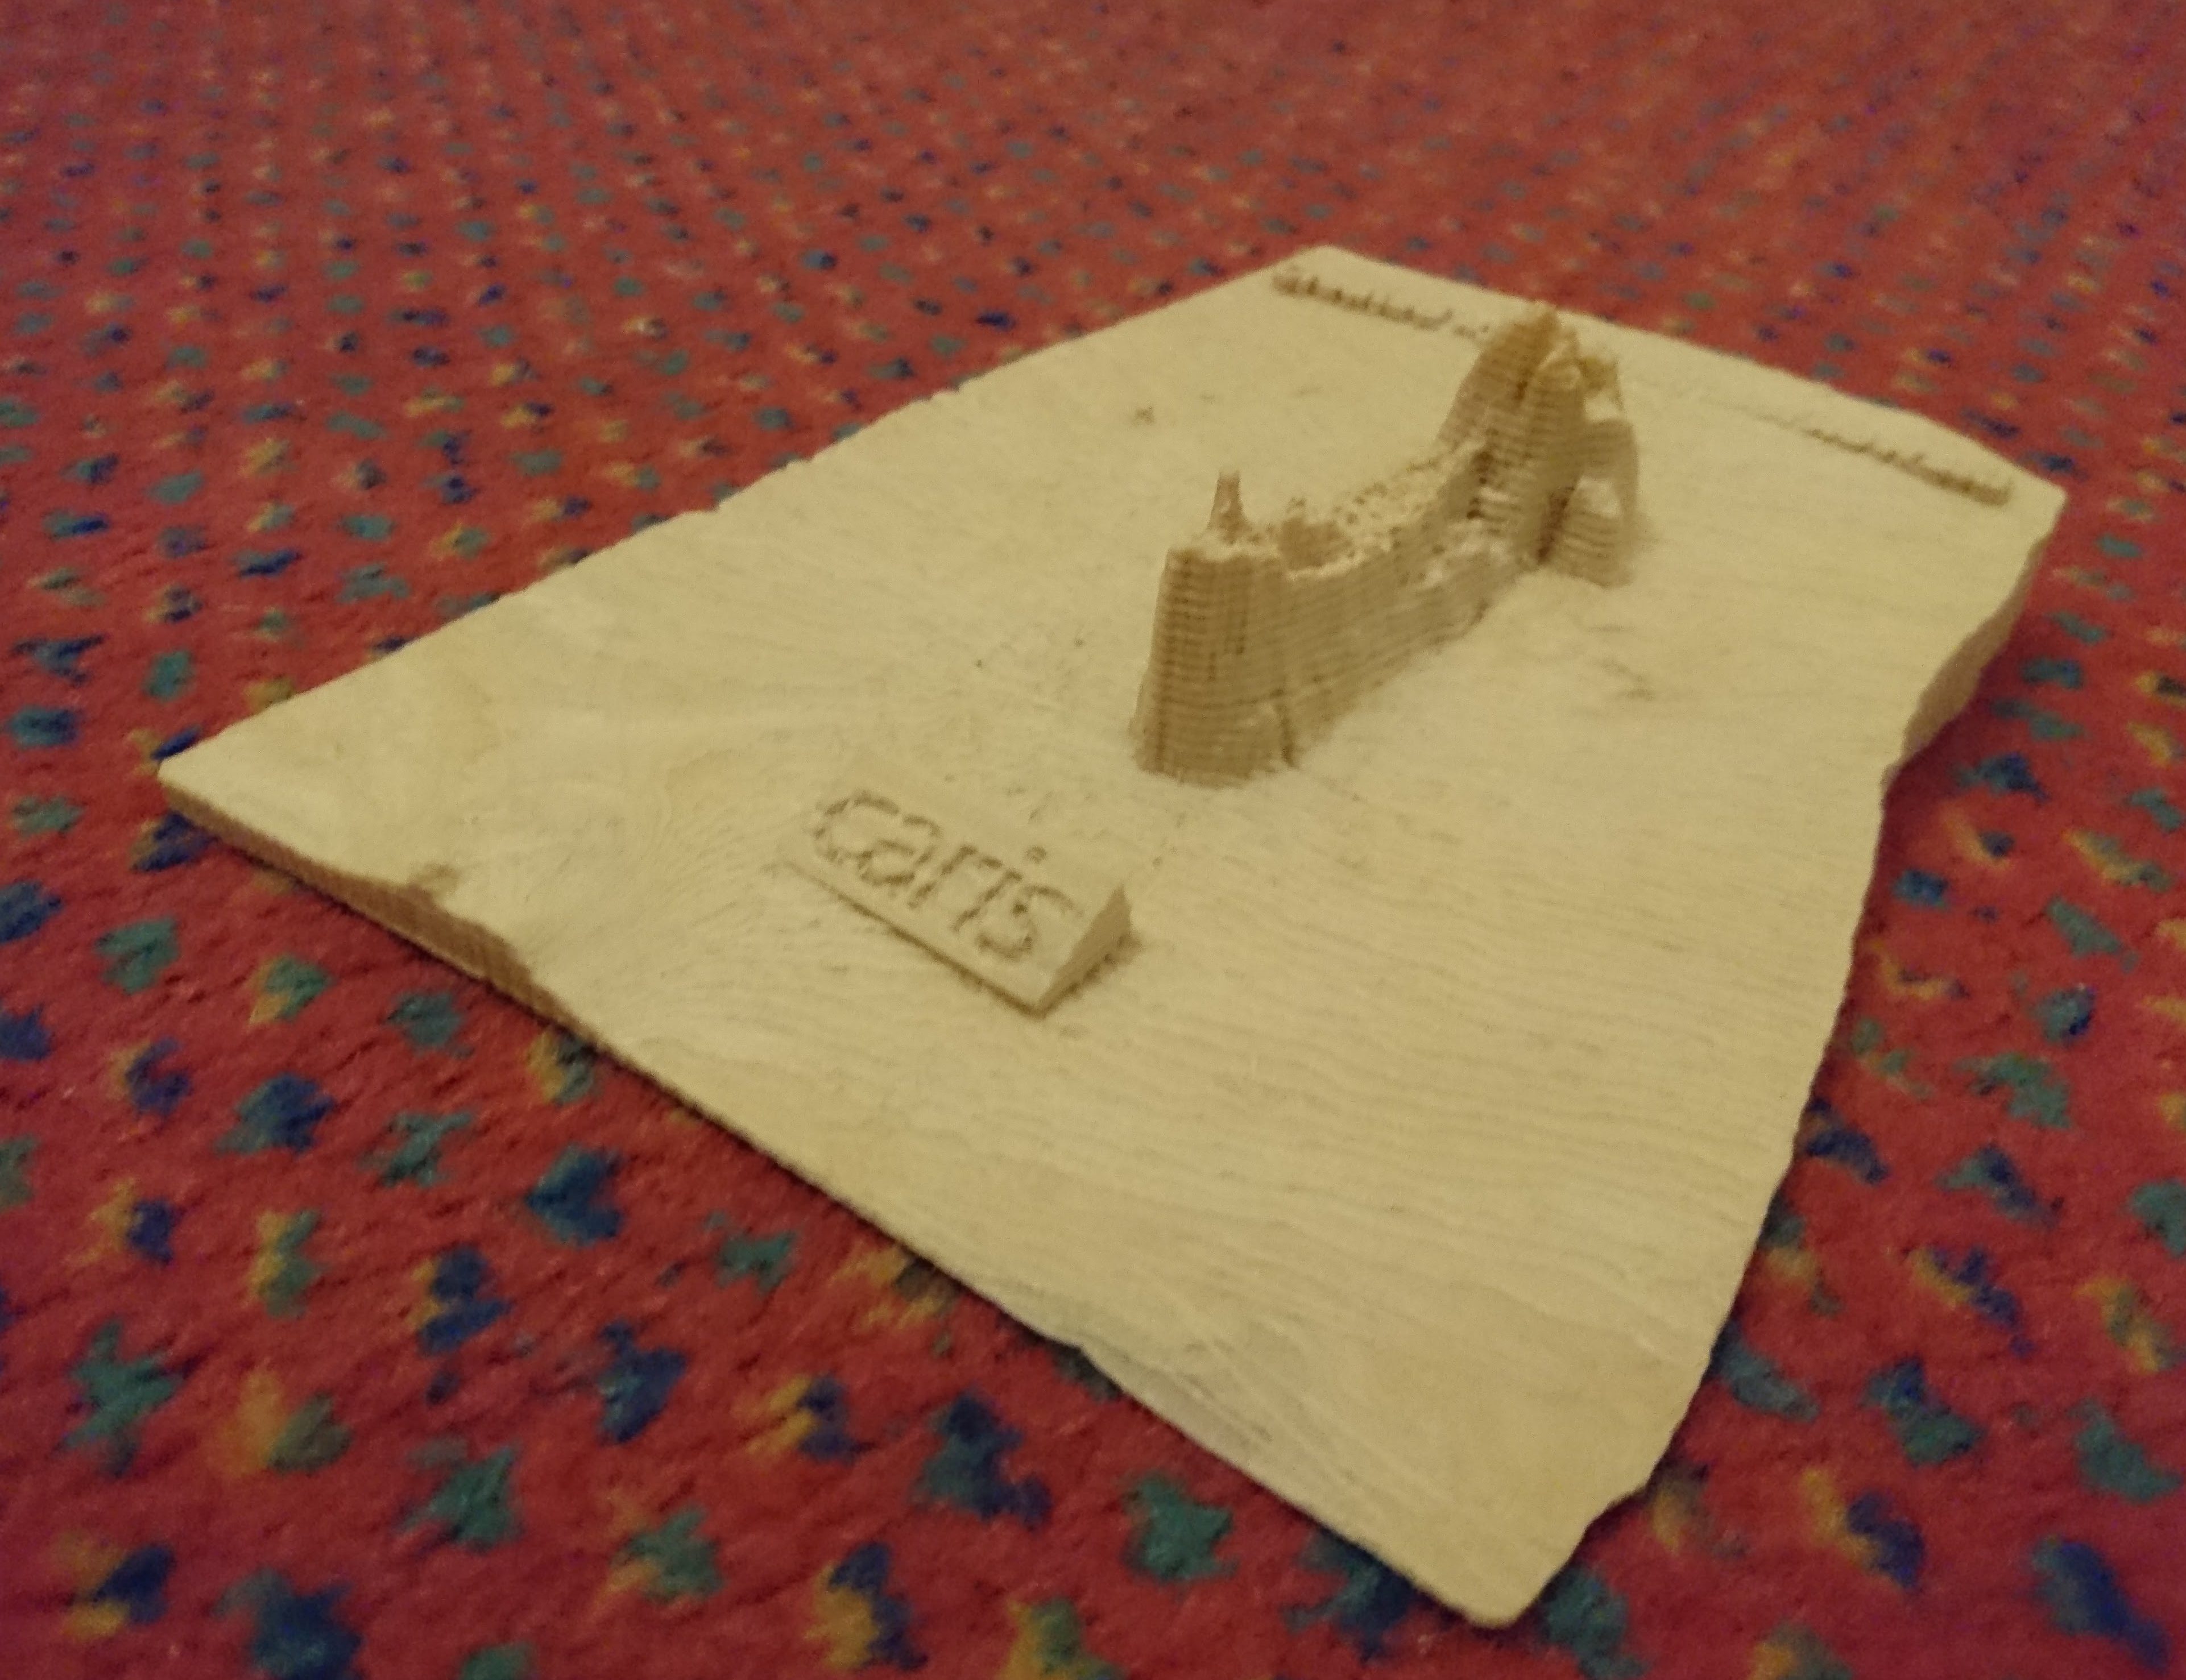
Mostly used method for cleaning is post-processing method – using processing software like CARIS HIPS or PDS, Hypack or QPS. In that case we run all the processing steps after survey and we are merging all collected information (position, motion, depth values etc.). Processing should deliver us a clean data – so data which are in the best way representing the bottom and depth values related to Chart Datum (so your reference level). From those data we can create contours and soundings – which would go to the chart – which is used for navigation. In that case hydrographer is responsible for final results and QC. He is the one who sign the papers. Normally this is Hydrographer Cat. A (Category A) – this is the highest rank in hydrography.
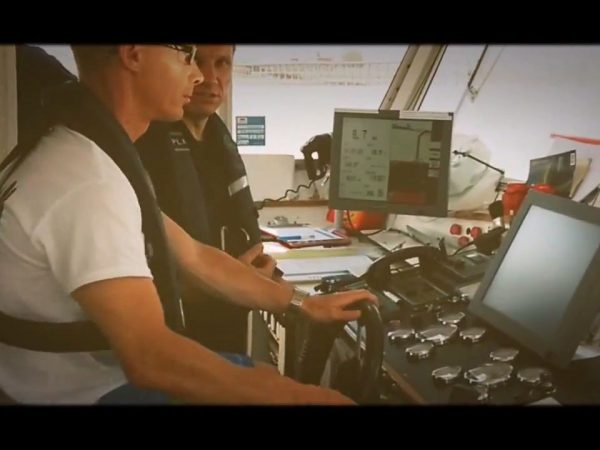
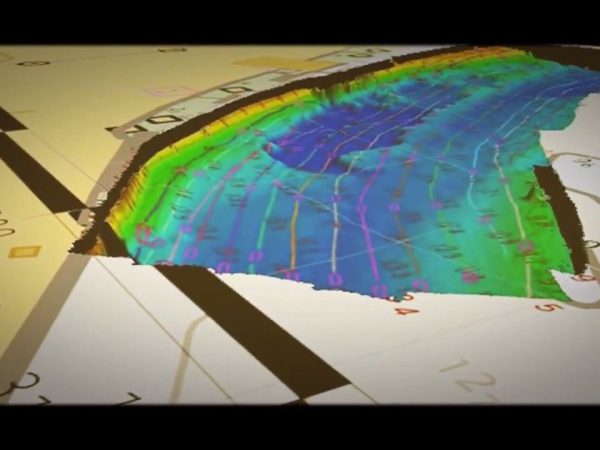
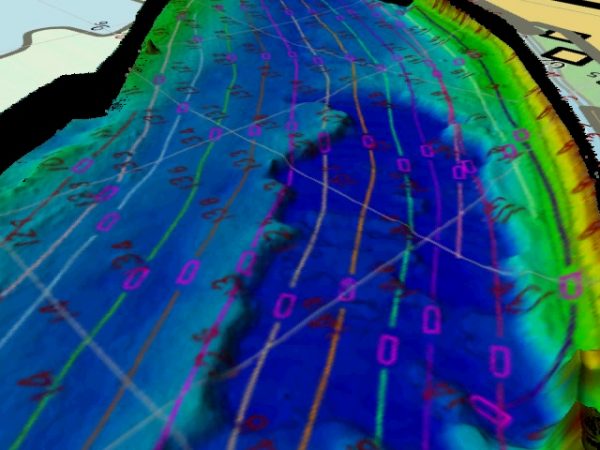
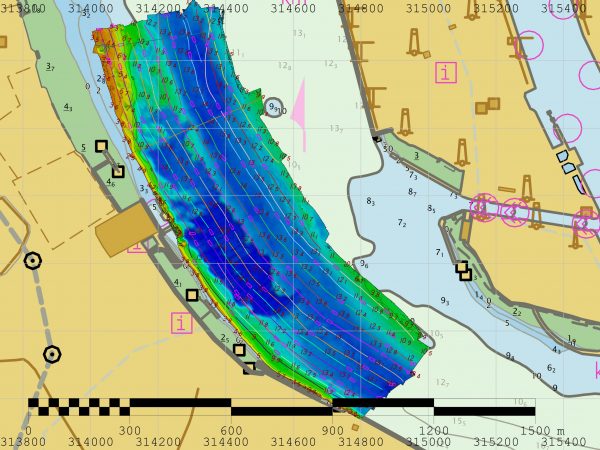
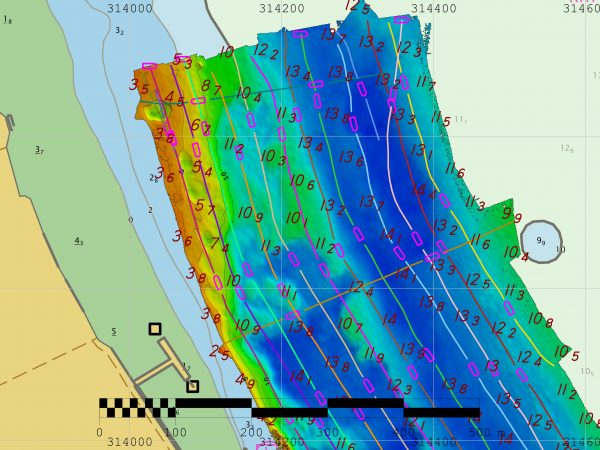
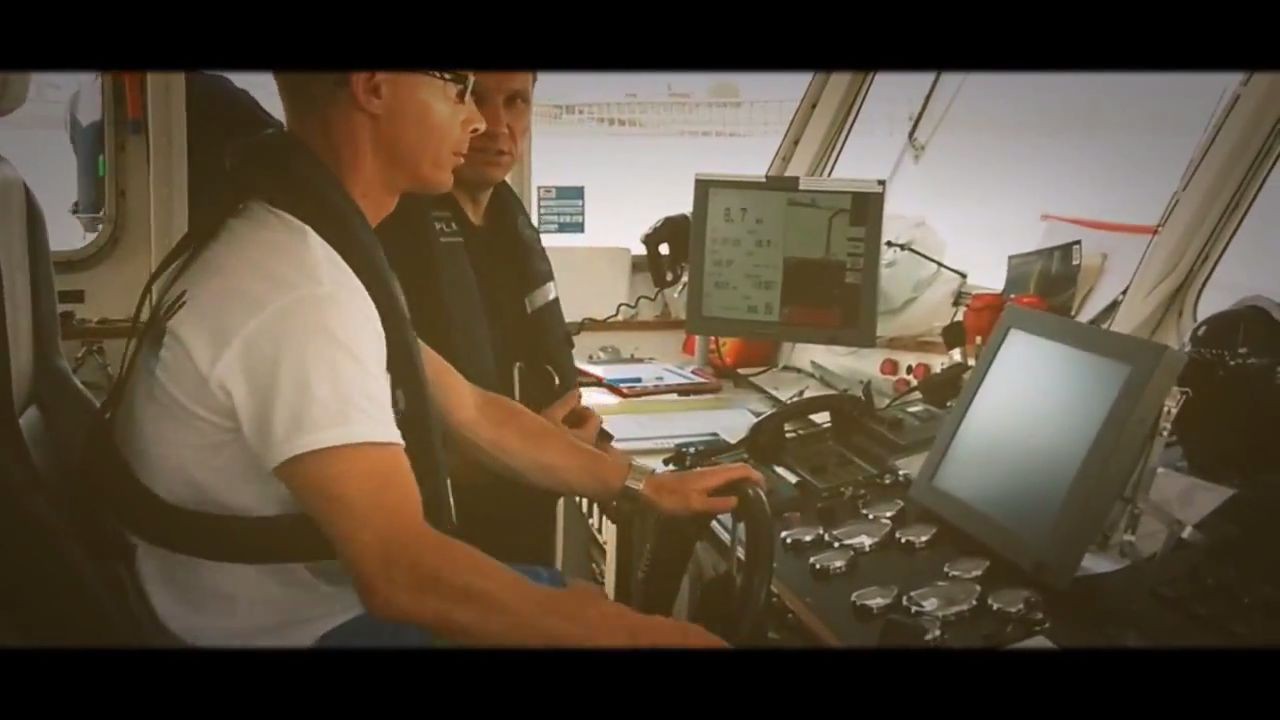
Just above you can see on photos how the data are looking like. Hydrographer at the end is preparing the data for Cartographers – and Cartographers at the end are preparing final charts. But if you look at the chart you would notice that every chart is signed by the Hydrographer of the country which is publishing this chart. He is at the end responsible for presented results. And going down – if there is mistake and there is accident at sea caused by wrong measurements – then as well Hydrographer Cat. A would be responsible.
Just below a short movie from survey which was done in Port of London with RESON – this was a workshop for surveyors and hydrographers – where we collected the data with MBES and then we processed the data using different software packages. Those data were processed using CARIS HIPS.
This is just very short description – just to give you overview. Please find some extra links to hydrographic pages below the movie.
Hydrography – Survey
Links
- International Hydrographic Organisation
- IHO Manual of Hydrography
- NOAA Ocean Service
- NOAA Office of Coast Survey and here you can find a good manual.
- UKHO Bathymetric Portal
- Hydro International
I didn’t include any links to hardware or software producers. Just to not promote any. If you know valuable pages about hydrography in general – please use form on side and let me know. I can add some extra links.